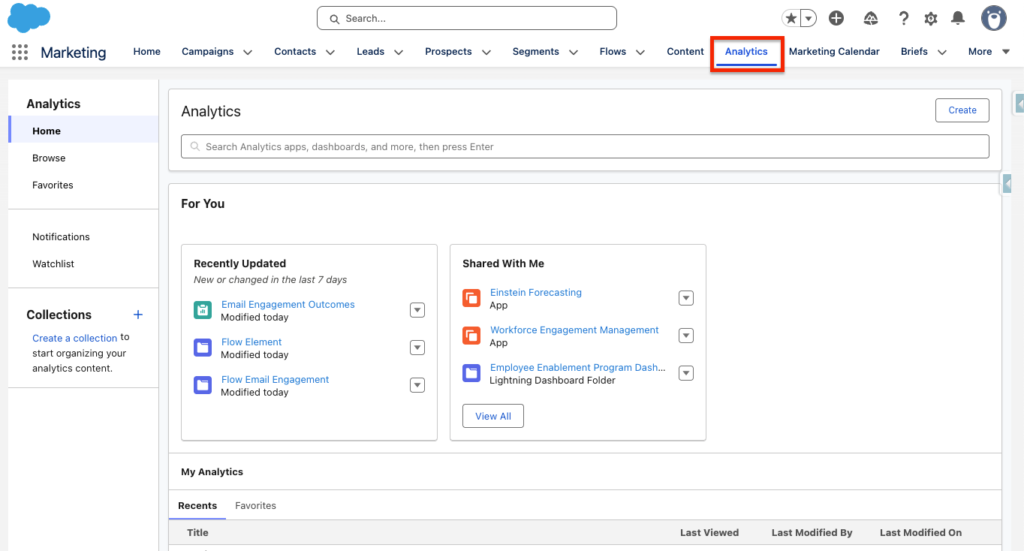
After installing the Marketing Data Kits and different Packages listed in the article related, you will have the possibility to access different Reports and Dashboards in Marketing Cloud Next. Navigate in the Analytics Tab of your Marketing App in order to access the different Dashboards and Reports.
Reports within the Campaign Tab #
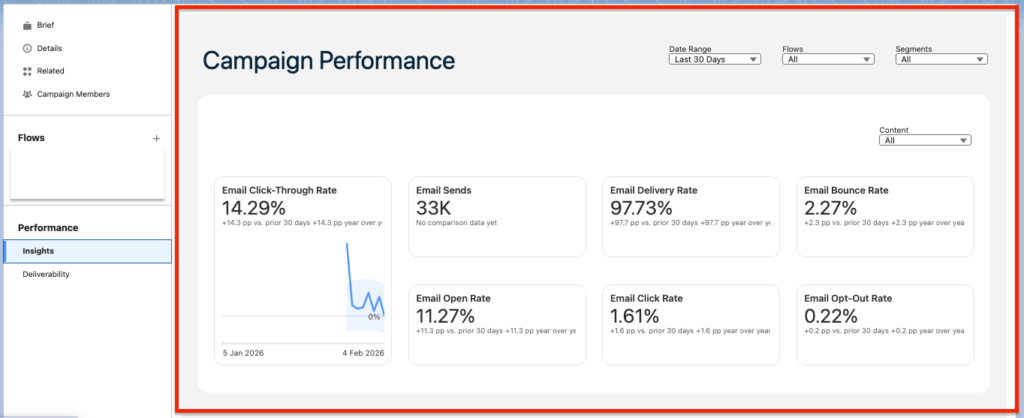
Something that I like about Marketing Cloud Next is that the Campaign object is centralising the Marketing Activities from content creation to analytics. To view analytics from a specific email campaign, simply navigate within the Marketing Performance tab and campaign records on your Marketing Campaign.
- Campaign Performance dashboard (Insights): Provide insights such as Email Click-Though Rate, Email Sends, Email Open Rate, Email Delivery Rate, Email Click Rate, Email Bounce Rate, and Email Opt-Out Rate. You have the possibility to filter by a specific date rage (i.e last 30 days), filter by a specific Campaign Flow (Or All of them to get a Global view), and Filter by a Specific Segment to understand how audiences are resonating with your email campaigns.
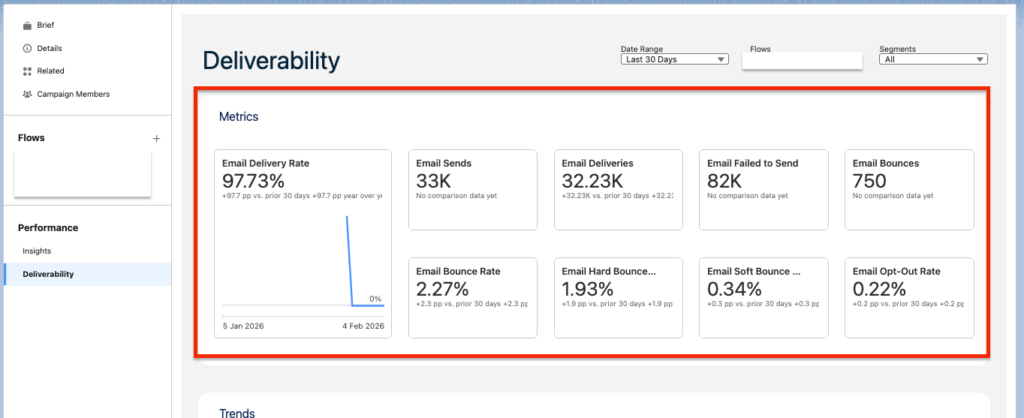
- Campaign Performance dashboard (Deliverability): This Dashboard available directly on your Campaign is provide a lot of valuable information to understand how well your campaign was delivered. You will be able to access the following metrics: Email Delivery Rate, Email Sends, Email Bounce Rate, Email Deliveries, Email Failed to Send, Email Bounces, Email Hard Bounced, Email Soft Bounced, Email Opt-Out Rate.
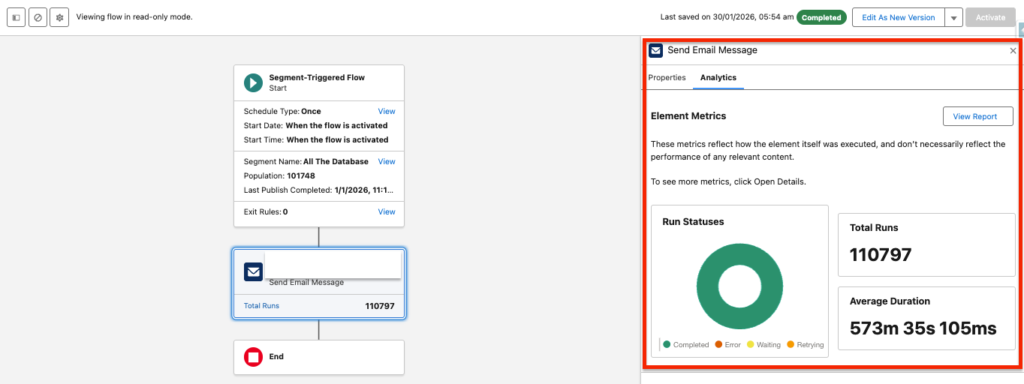
Reports within the Flow Builder Tab #
When navigating on a Flow Element such as Send Email Message, we have now the possibility to navigate to the Analytics Tab to understand how many times the Flow Action has run – and their status (Completed, Error, Waiting, Retrying). We can also get insights on the Average Duration for the total number of runs.
Reports and Dashboards within Analytics Tab #
Many other Reports and Dashboards related to Marketing Cloud Next can be found within the Analytics Tab. Marketing Cloud Next Dashboards and Reports are relaying on the D360 (Data Cloud) Report feature, meaning that you can use the default Dashboards & Reports but also customise them as you wish.
Email Engagement #
- Email Engagement dashboard: A big-picture look at standard email marketing KPIs that you can filter by email, campaign, date range, and more.
- Email Engagement reports: A group of individual reports that focus on common email marketing KPIs.
SMS Engagement #
- SMS Engagement dashboard: A big-picture look at standard SMS marketing KPIs that you can filter by email, campaign, date range, and more.
- SMS Engagement report: A group of individual reports that focus on common SMS marketing KPIs.
Forms Engagement #
- Forms Engagement report: A group of individual reports that focus on common form KPIs.
- Forms Engagement dashboard: A big-picture look at form KPIs that you can filter by date, public title, and more.
Landing Page Engagement #
- Landing Page Engagement report: A group of individual reports that focus on common landing page KPIs.
- Landing Page Engagement dashboard: A big-picture look at landing page KPIs that you can filter by date, public title, and more.
Ressources:
https://help.salesforce.com/s/articleView?id=mktg.mktg_reporting_types.htm&type=5


